Proof that Rugby has not become unwatchable | Data Journalism | Infographic
Some people say that the game of rugby has become too slow and boring at times!
The following infographics take a look at this in greater detail and reveal some very interesting facts which counteract this criticism of traditional strategy. Is it really unwatchable when teams seek goal kicks for advantage… and is that even what teams are doing in reality. the facts below paint a better pitcure of what is happening.
Source: Betway Insider
“We analysed the past decade of 6 Nations tournaments to present some data to show that Rugby is more smash and bang than ever, contrary to popular opinion.
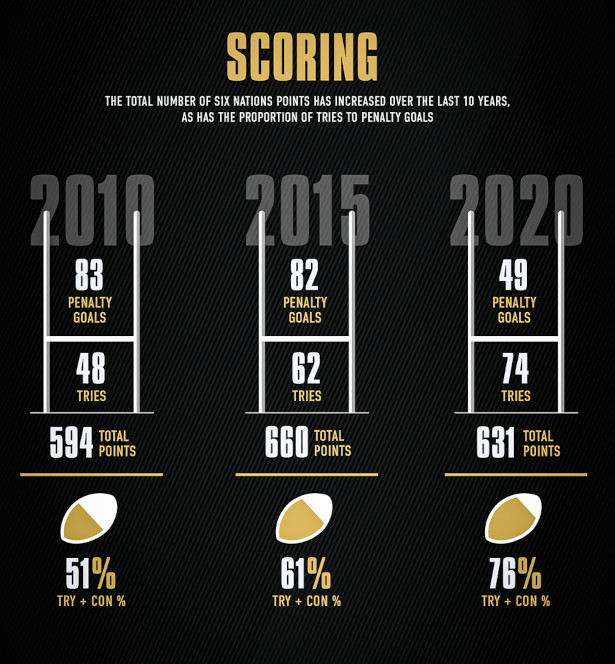
• Teams are scoring more frequently with the last tournament averaging 46 points a game
• Points scored are more frequently tries than kicks. The last tournament saw a points – try to penalty – ratio of 76:24
• Number of passes has been rising since 2010 with highs of 354 per match in 2018
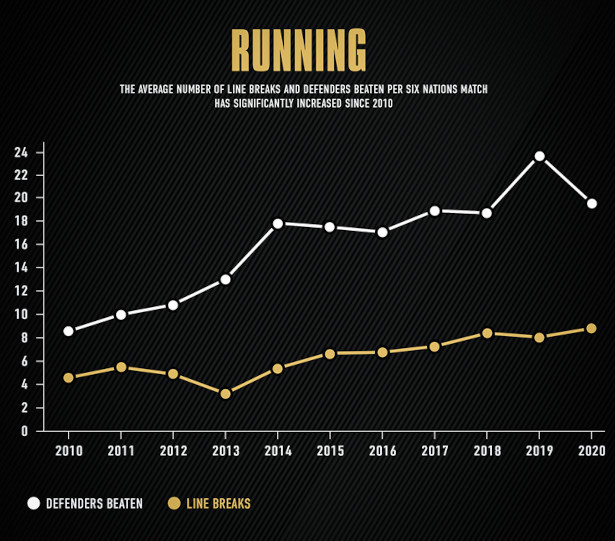
• There were 8.6 line breaks on average per game in 2020″
For us at Intouch & Rugby Rep publications the sheer unadulterated excitement of the game has actually been on the increase in recent years. So much so that France 2023 is now firmly on the horizon as probaly the greatest rugby World Cup yet. To bolster this the French have been starting to put together that invincible style of play that realy teams who win tournaments become identified with…
Let alone the resurgence of spirited gutsy and talented Scotland sides who are inspiring fans all over the World. From the wider diaspora of Scots not to mention the extemely determined and accomplished approach of England. Combine this with the Northern Hemisphere having 2 out of the 4 spots ( England (no 2 ) & France ( no 4) ) in the top 4 in the World and the Northern Hemisphere boasting 6 of the top 9 in the world. Surely the Northern Hemisphere must really be the No1 hemisphere in the world! If these types of rankings continue the final surely in 2023 would really have atleast one Northern Hemisphere side. Surely the facts of the talent of the teams shows that they must do really well at the next World Cup and very possibly win it out right… because the data is so accurate….
However the excitment of the game is encapsulated superbly in the graphics below which show a number of startling variables looking at the frequency of scoring. How many tries per game, how many kicks for goal. Also then looking at passes as the open play leading up to a game can be so exciting and passing is a great sign of great play!
It turns out the Six Nations is way ahead of 10 odd years ago!
Its clear to be seen from the graphics that the game is thriving in terms of excitment and its potential to engage viewers. In fact the passions are so high and fans so involved that its simply the case that emotions are running high and games are just fyling by!
So!
We look forward to the rest of the Six Nations and expect some thrilling encounters to follow!
Very, very best wishes!
The Team & InTouch & Rugby Rep Publications UK & the United States Of Amrerica.